FibroCeram Materials
Thermal insulation installation often looks straightforward. It is not. Gaps, compressed sections, and poorly sealed joints can quietly reduce performance and increase energy loss.
To Optimize installation efficiency of thermal insulation systems, teams need more than faster labor. They need clear drawings, suitable materials, accurate measurements, and a repeatable inspection process. Experienced installers begin by checking substrate condition, moisture, access, and temperature. A clean, dry surface helps adhesives and sealants perform as intended. Correct cutting also matters. A two-centimeter gap around a pipe can undermine an otherwise careful installation.
Professional practice connects site experience with manufacturer instructions, project specifications, and applicable building requirements. Supervisors should verify material thickness, fixing density, vapor-control continuity, and protection against mechanical damage. Photographs, batch records, and inspection checklists make decisions traceable. They also help clients compare planned performance with actual work. Small details count.
Efficiency is not simply speed. It means consistent quality, fewer repairs, less waste, and safer working conditions. Yet no method is perfect. Weather changes, crowded plant rooms, and rushed handovers can expose weaknesses in strong procedures. Teams should review these failures honestly and adjust their workflow. A practical approach tests one installation area, measures results, and improves the method before wider rollout. This article examines proven techniques, common mistakes, and realistic controls for dependable insulation work.
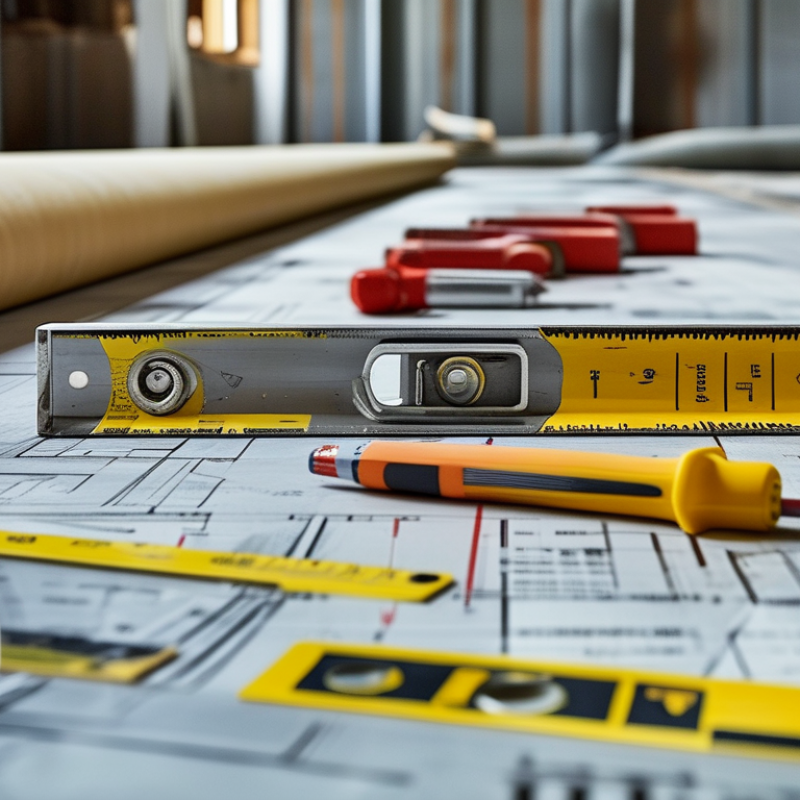
How to Optimize Thermal Insulation Installation Efficiency?
Thermal insulation efficiency starts with a clear U-value target. ISO 6946 provides the calculation method for building elements such as walls, roofs, and floors. It does not set the legal target itself. Local energy codes usually define maximum U-values according to climate, building type, and construction location. Confirm these limits before ordering materials.
Calculate each layer’s thermal resistance, including insulation, finishes, cavities, and internal and external surface resistances. Express the final U-value in W/m²K. A lower value indicates better thermal performance. Keep the calculation record beside the installation drawings. This helps installers understand the required insulation thickness and prevents rushed substitutions. Small gaps matter.
On site, check whether insulation boards fit tightly around corners, service penetrations, and structural supports. Compressed mineral insulation can lose effective thickness. Unsealed joints may also create unwanted heat paths. ISO 6946 calculations may need adjustments for repeating thermal bridges, while major bridges often require separate assessment under local rules. In my experience, drawings rarely show every fixing or irregular cavity. That is a weakness worth admitting. Use photographs, moisture checks, and spot inspections before closing the assembly. Recalculate when the material, density, thickness, or layer order changes. A quick installation is not efficient if corrective work follows. Performance depends on both the equation and the workmanship.
ISO 6946 provides the calculation method for thermal transmittance, or U-value, but does not establish mandatory limits. This chart uses maximum U-value benchmarks from England's 2021 energy-efficiency requirements for common opaque building elements. Lower U-values indicate better thermal insulation performance. Final targets should be checked against the applicable local energy code and verified using the ISO 6946 resistance-layer method, including surface resistances, thermal bridges, and correction factors.
Efficient insulation work starts with the right thermal data, not a convenient product label. A lower λ-value means the material conducts less heat. However, λ-value alone cannot predict performance inside a wall or roof. R-value shows resistance to heat flow. Higher R-value usually means better resistance, but thickness, moisture, temperature, and compression also matter.
During a recent site review, I found several boards with excellent laboratory values. Small gaps around pipes still reduced their practical performance. That was a useful reminder. Installation quality can defeat good specifications. Measure the available cavity, plan clean cuts, and avoid crushing flexible insulation. Even a narrow unsealed joint can create a visible path for heat movement.
ASTM C518 test data adds useful evidence because it measures thermal transmission with a heat flow meter apparatus. Review the reported λ-value, test temperature, specimen thickness, density, and conditioning details. These details must match the intended application as closely as possible. Ask for complete laboratory documentation, not only a single headline number. Check whether the data is declared, aged, or based on a fresh sample. Results can vary.
Keep records.
After installation, inspect seams, edges, penetrations, and compression marks. A thermal camera can reveal suspicious cold areas, although it cannot replace professional testing. I still question overly precise claims. Real buildings experience wind, humidity, movement, and imperfect workmanship. Selecting insulation means balancing tested resistance with what workers can install consistently.
Efficient insulation begins with the substrate, not the cutting knife. Inspect walls, roofs, and service areas for moisture, dust, uneven surfaces, and loose fasteners. A damp or contaminated substrate can reduce adhesion and force later removal. The U.S. Environmental Protection Agency reported 600 million tons of construction and demolition debris in 2018. Avoiding rework helps keep a small installation waste stream from becoming a large disposal problem.
Set a clear waste target below 10% before materials arrive. Measure each bay, pipe penetration, corner, and opening twice. Record dimensions on a simple cutting sheet. Cut large panels in batches, then reserve clean offcuts for narrow cavities and service zones. Keep a marked scrap box beside the cutting table. It prevents usable pieces from mixing with damaged materials. Small habits matter.
Leave room for mistakes. Real substrates are rarely square, and drawings can be outdated. I have seen carefully planned cuts fail around unexpected conduits. A flexible template can prevent that repeat. Installers should check fit without compressing the insulation, because compression can reduce designed thickness and thermal performance. The International Energy Agency reported that buildings consumed about 30% of global final energy in 2022. Better installation supports efficiency, but waste control must not sacrifice coverage, continuity, or safe workmanship.
Thermal insulation works best as one unbroken layer. On site, installers should keep boards tight against the structure. Even a narrow gap can create a cold path. Continuous insulation also reduces heat flow through framing members. The UNEP GlobalABC 2023 report states that buildings consume about 30% of global final energy. Better installation can reduce this demand. It cannot fix every design problem, though.
Stagger joints between adjacent insulation layers. Offset vertical seams by at least half a board where the system allows it. This reduces direct routes for heat, air, and moisture. Seal penetrations around pipes, brackets, and service openings. ISO 10211 provides calculation methods for thermal bridges, including junctions around walls, roofs, and floors. A perfect drawing still fails when installers compress boards or leave exposed corners. I have seen this happen during rushed winter work.
Tips: Mark the first layer before cutting. Use clean, square edges. Check corners with a straightedge. Photograph each completed layer before covering it. Review thermal bridge details with the designer, not after defects appear. Measure difficult junctions twice. Small errors become expensive corrections. Also, avoid assuming every gap is harmless; that assumption needs evidence from inspection and calculation.
How to Optimize Thermal Insulation Installation Efficiency?
Verify Air Leakage Below 0.6 ACH50 Using Blower-Door and IR Testing
Efficient insulation work starts with airtightness, not simply thicker batts. The U.S. Department of Energy estimates that air leakage can represent 25–40% of heating and cooling energy use in typical homes. A blower-door test measures whole-building leakage at 50 pascals. The result, ACH50, shows how many times the indoor air volume leaks hourly. Passive House Institute criteria set a demanding target of 0.6 ACH50. Use this benchmark before closing walls, not after complaints appear.
Seal penetrations around windows, wiring, plumbing, top plates, and service cavities. Then run the blower door again. ASTM E779 and ISO 9972 provide recognized testing procedures. Infrared testing adds useful visual evidence during pressure changes. It can reveal cold streaks, missing insulation, and air paths near ceiling corners. However, an IR camera does not measure leakage alone. Temperature differences and operator skill affect the image.
Small gaps matter. Retest immediately. Experienced crews should record pressure, indoor temperature, outdoor temperature, and leakage volume each time. A failed result needs investigation, not cosmetic patching. I have seen carefully installed insulation underperform because one unsealed attic hatch dominated the leakage pattern. That is an uncomfortable reminder: installation speed means little without verification. The 2021 International Energy Conservation Code permits 3 or 5 ACH50, depending on climate zone, so achieving below 0.6 ACH50 requires tighter workmanship than minimum compliance. (U.S. DOE; Passive House Institute; ASTM E779; 2021 IECC)
Example field-verification dataset for coordinating insulation installation, air-sealing work, blower-door testing, and infrared thermography.
| Installation Phase | Performance Dimension | Measurement or Calculation | Acceptance Target | Initial Result | Verified Result | Efficiency Action |
|---|---|---|---|---|---|---|
| 1. Pre-installation survey | Building enclosure volume | Measured conditioned volume: 12,000 ft³ | Accurate volume required for ACH50 calculation | 12,000 ft³ | 12,000 ft³ | Confirm dimensions before testing and record all conditioned spaces. |
| 1. Pre-installation survey | Air-barrier continuity | Visual inspection of wall, ceiling, floor, window, door, and service penetrations | No visible discontinuities at the primary air barrier | 7 leakage locations | 0 visible open penetrations | Mark leakage points before insulation conceals the air barrier. |
| 2. Insulation installation | Insulation coverage | Insulated area ÷ specified area × 100 | 100% of designated area covered | 91% | 100% | Use an installation checklist and inspect narrow cavities before closing. |
| 2. Insulation installation | Insulation thickness | Field depth readings at representative locations | Within the project specification at every inspected location | Average 128 mm; 5 thin areas | Average 152 mm; no thin areas | Correct compression, voids, gaps, and incomplete cavity fills immediately. |
| 2. Insulation installation | Compression and gaps | Visual inspection and probe check at joints and perimeter edges | No open gaps or significant compression that reduces designed R-value | 14 gaps; 6 compressed sections | No open gaps observed | Cut and fit insulation accurately around framing and service penetrations. |
| 3. Air-sealing correction | Penetration sealing | Electrical, plumbing, duct, window, door, and attic-transition inspection | All identified penetrations sealed with compatible materials | 7 locations unsealed | 7 of 7 sealed | Prioritize high-impact leakage paths while the blower door is operating. |
| 4. Blower-door test | Test pressure | Depressurization test at 50 Pa pressure difference | Stable pressure near 50 Pa in accordance with the selected test procedure | 50 Pa | 50 Pa | Close exterior openings and document test conditions before recording airflow. |
| 4. Blower-door test | Airflow at 50 Pa | Measured airflow used for ACH50: CFM50 × 60 ÷ volume | Lowest practical airflow consistent with the project target | 184 CFM50 | 116 CFM50 | Use guarded pressure testing to locate remaining leakage before retesting. |
| 4. Blower-door test | Air changes per hour at 50 Pa | ACH50 = CFM50 × 60 ÷ 12,000 ft³ | < 0.60 ACH50 | 0.92 ACH50 | 0.58 ACH50 | Retest after every major air-sealing correction and record the final value. |
| 5. IR inspection | Thermal imaging conditions | Indoor-outdoor temperature difference during scan | Preferably about 10°C or more for clear thermal patterns | 6°C difference | 12°C difference | Schedule scanning during a stable temperature period and avoid direct solar loading. |
| 5. IR inspection | Thermal anomalies | Infrared scan performed while the building is under blower-door pressure | No continuous cold bands, bypasses, or concentrated leakage signatures | 11 anomalies | 2 minor anomalies; no continuous bypass | Combine IR images with visual inspection and smoke or pressure diagnostics. |
| 6. Final quality control | Documentation completeness | Photos, test settings, airflow, ACH50, weather, and corrective actions | Complete and traceable verification record | Incomplete | Complete | Store test reports and annotated images with the installation checklist. |
: A lower λ-value means the insulation conducts less heat. It does not guarantee strong field performance.
R-value shows resistance to heat flow. Higher R-value usually helps, but thickness, moisture, temperature, and compression also matter.
Review λ-value, test temperature, specimen thickness, density, and conditioning details. Ask for complete laboratory records.One number is insufficient.
Small gaps around pipes, corners, or board joints can create direct heat paths. Cut boards cleanly and seal exposed openings.
Keep layers continuous and stagger adjacent joints. Offset vertical seams by about half a board when the system permits.
Cover framing and junctions continuously. Review wall, roof, and floor details before installation, not after defects appear.
It measures building air leakage at 50 pascals. The result, ACH50, shows hourly air changes caused by leakage.
Infrared images can reveal cold streaks, missing insulation, and air paths near ceiling corners. Temperature differences can affect results.It is helpful, not perfect.
A target below 0.6 ACH50 requires very careful workmanship. Seal windows, wiring, plumbing, hatches, and top plates, then retest.
Record test pressure, temperatures, leakage volume, seams, penetrations, and compression marks. Photograph each insulation layer before covering it.Records expose weak spots.
To optimize installation efficiency of thermal insulation systems, begin by defining clear U-value targets according to ISO 6946 and applicable local energy codes. Select materials based on their declared lambda value, R-value, and reliable ASTM C518 test data to ensure the insulation meets both thermal and performance requirements. Before installation, inspect and prepare substrates, remove irregularities, and plan cutting layouts carefully to keep material waste below 10%.
During installation, maintain continuous insulation layers, stagger joints between adjacent sections, and minimize gaps around penetrations, corners, and structural connections to reduce thermal bridging. Proper sequencing and accurate detailing can improve productivity while supporting long-term energy performance. After the work is complete, verify the building envelope with blower-door testing, targeting air leakage below 0.6 ACH50, and use infrared scanning to identify hidden gaps, compression, or discontinuities. Combining careful design, efficient material handling, precise installation, and performance testing helps achieve consistent insulation quality and dependable energy efficiency.